applying Machine Learning for Company Sentiment Analysis
Abstract
We investigate the application of machine learning techniques to analyze company sentiment through textual data. By employing natural language processing and sentiment analysis algorithms, we can quantify positive and negative words within company filings. The findings reveal that The most positive LDA topic (yields the most positive return) seems to revolve around restructuring events and impairment charges while the most negative LDA topic (yields the most negative return) is clearly tied to financial losses and allowance. These insights underscore the potential of machine learning in extracting valuable information from unstructured data, aiding businesses in understanding market perceptions and informing strategic decisions.

Image generated using AI, prompted by “Give me an image depicting financial statement analysis for Netflix, Google, and Apple including financial reports, charts, and stock performance trends.”
Background
Publicly traded companies announce earnings four times per year. These quarterly announcements convey significant information to the market about the company's performance as well as expectations about performance in the coming period. While Wall Street often focuses on whether earnings-per-share (EPS) "meets or beats" expectations, this metric represents only one data point in the announcement.
Managers supplement announced earnings with a detailed narrative disclosure which provides information helpful for interpreting performance. Today, we will analyze these narrative disclosures using a few different machine learning approaches:
We will apply topic modeling to understand the type of language in earnings announcements.
We will use Lasso regression to evaluate which topics best predict stock returns.
step 1: Data Preparation
This data was scraped from the SEC’s EDGAR database and limited to 12,500 rows.

Clean out the "bad" sentences
Approach:
Generate a list of sentences with
sent_tokenizeLoop over each sentence
Identify financial numbers with a regular expression, and replace those with "financial_number".
Tokenize words in the sentence with
word_tokenize, and filter out non-alpha or non-"financial_number". Retain good tokens ingood_tokens.Evaluate sentence per the parameters above (5 or more tokens, no more than 50% financial numbers)

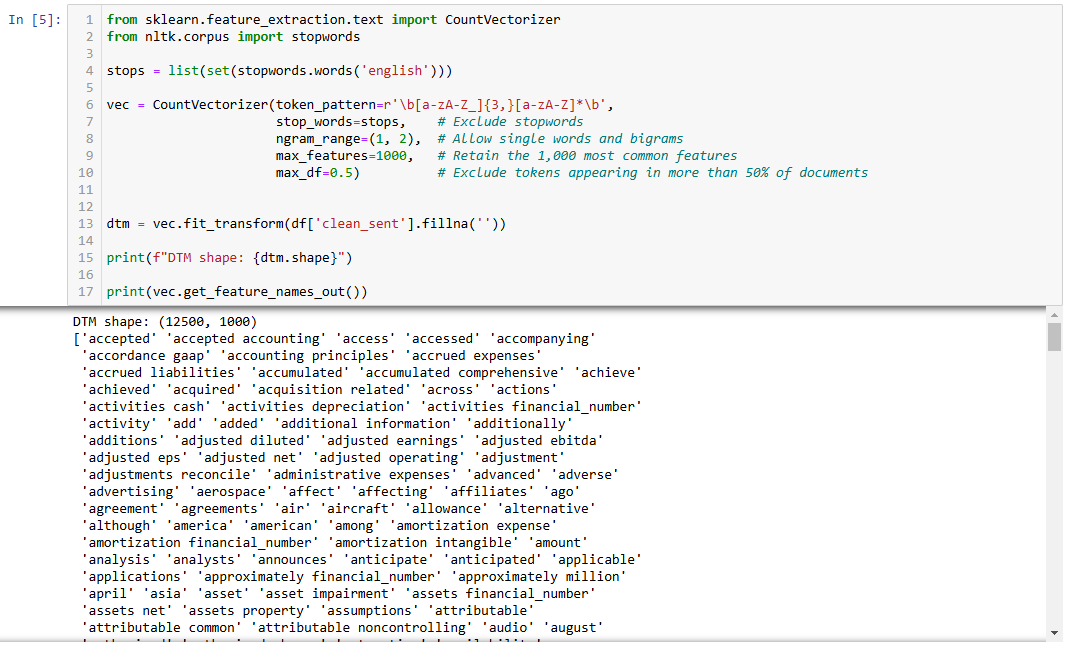
Now we will generate our document term matrix. Note that you need use CountVectorizer since we are going to use LDA.
I use Scikit-learn (sklearn) because it’s a powerful and easy to use open-source machine learning library in Python that provides simple and efficient tools for data mining, analysis, and machine learning modeling.
Background on Latent Dirichlet Allocation (LDA)
LDA is a probabilistic topic modeling algorithm that is used to discover latent topics within a collection of documents.
LDA assumes that:
Each document is a mixture of multiple topics.
Each topic is a distribution over words.
The algorithm assigns probabilities to words and documents to determine the most relevant topics.
LDA works by iteratively updating topic distributions based on word co-occurrence patterns in documents.
Step 2: Fitting the LDA Model
Next, we're going to generate topics from our document term matrix using LDA. We'll do this step in four parts:
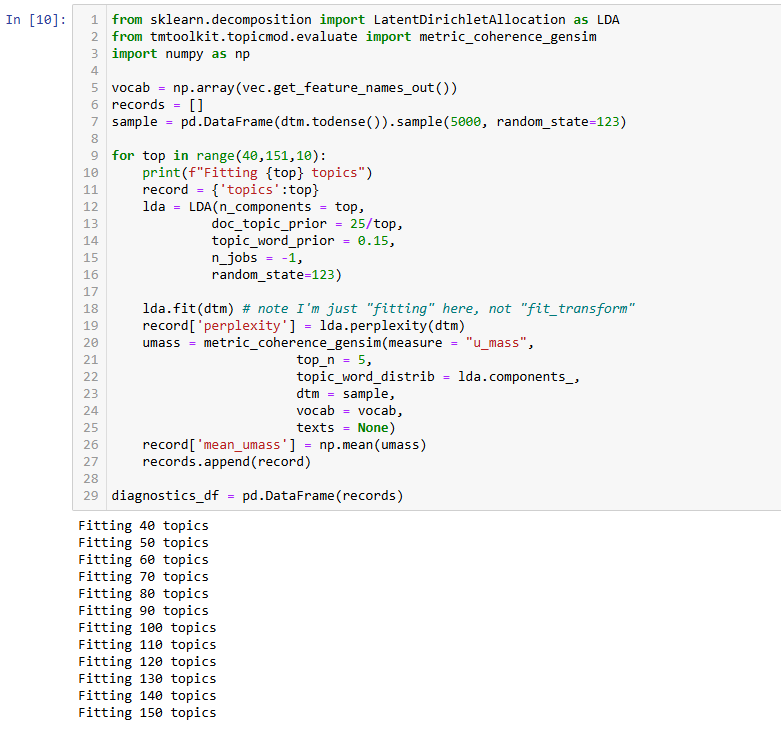
Fitting LDA model over a range of topics
Evaluating diagnostics to select "best" choice
Fit a final model and generate topic scores
Evaluate top 5 words in each topic
Step 3: Evaluating Topic Quality
Next, we will use the coherence score, u_mass, to evaluate topic quality. u_mass is used to evaluate topic quality in topic modeling because it measures the co-occurrence of words within a topic based on how often they appear together in a given corpus. Here’s the logic behind it:
A good topic should contain words that frequently appear together in documents.
u_masscalculates the log-likelihood of words occurring together in a corpus, helping determine if a topic consists of semantically meaningful words.u_massis calculated using a sliding window approach over documents, checking how often words in a topic co-occur.A higher
u_massscore suggests that words in a topic frequently appear together, making the topic more interpretable.Topics with high coherence scores usually contain words that logically fit together (e.g., ["stock," "market," "shares," "trading"] would have a high score).
Topics with low coherence scores may contain unrelated words (e.g. [“millions”, “September”, “currency”, “operations”] would have a low score).
Unlike metrics that require human labels,
u_massis derived purely from document statistics, making it valuable for unsupervised topic modeling.
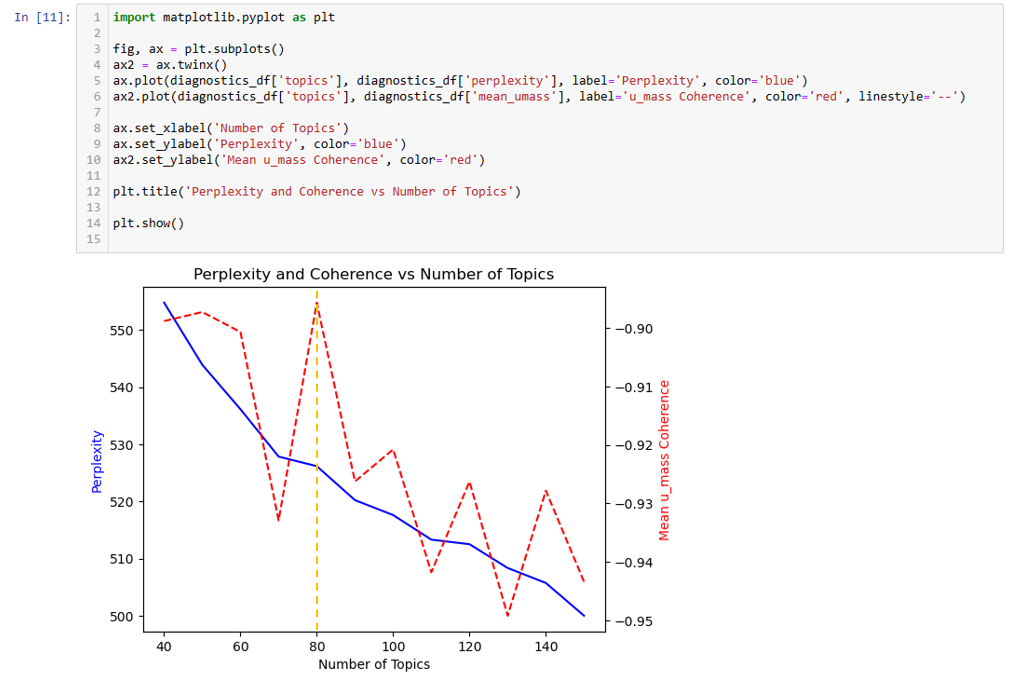
To determine the optimal number of Topics, for u_mass (red dashed line), higher the value = better (marked by the orange dashed line) so if we were using that we'd probably choose 80 topics or so. For Perplexity (blue line), we are looking for the area where the "elbow" occurs, and from that we'd probably pick around 80 topics.
However, as this graph shows, these two mathematical approaches have some drawbacks and given the scale of the y-axis, the values are relatively similar in topic quality.
Topic Fitting
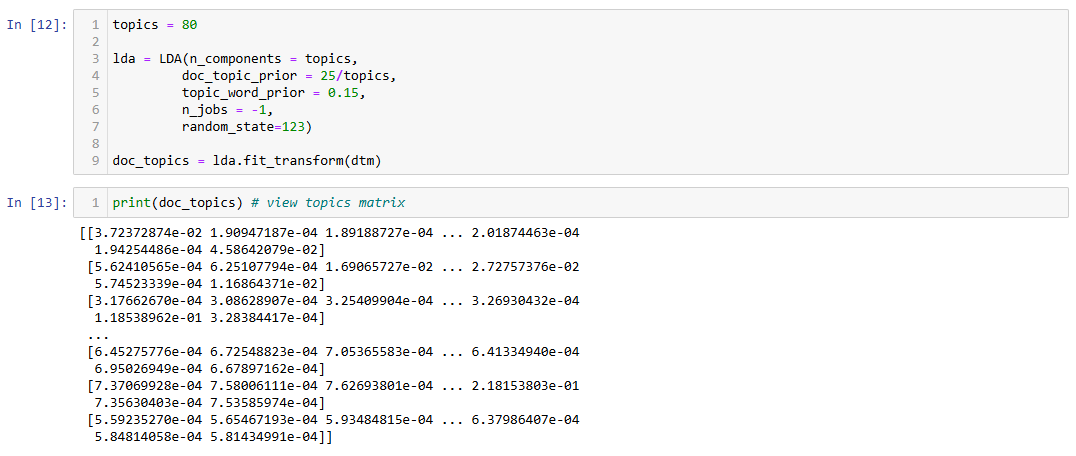
Now, we fit a final LDA model using the 80 topics chosen in the prior step and use it to transform the data.
The final step is to evaluate the words in the topics. Word intrusion tasks are a good way to validate topics in an objective manner. We will display the top 5 words in each topic and a randomly chosen word from the vocabulary, separately identified as an intruder.
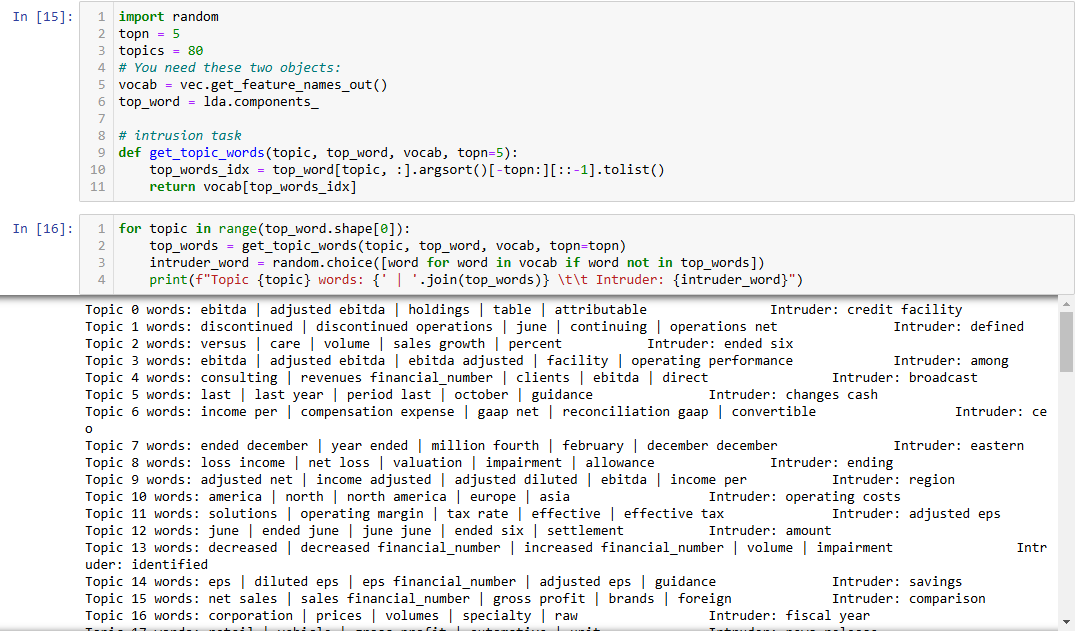
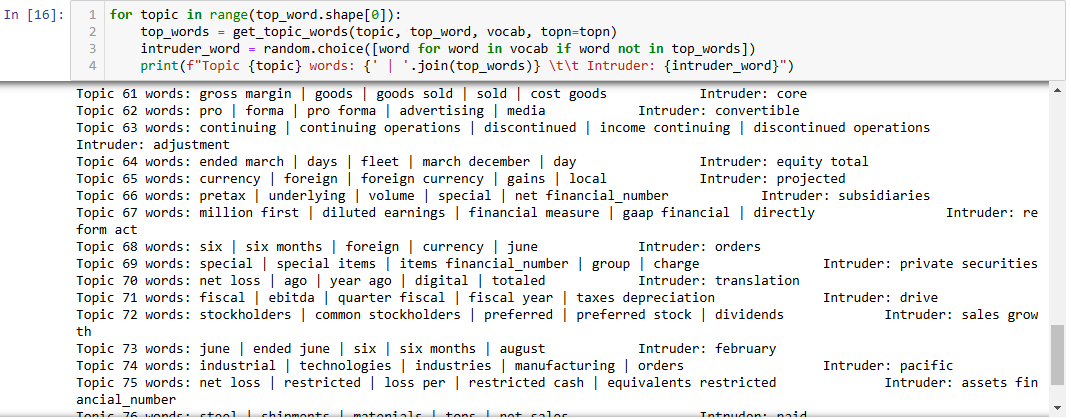
Additional Topic results shown below:


A few observations:
Several topics seem to repeat very similar themes, particularly around EBITDA and earnings
Topic 0, 3, 29, 44 all have "ebitda," "adjusted ebitda"
Some topics seem to combine unrelated words, leading to confusion:
Topic 16: "corporation," "prices," "volumes," and "specialty" seem to indicate corporate financials, but the intruder is "fiscal year," which should not be too different from these terms. However, the context of "specialty" and "raw" might imply that the topic was poorly defined.
Topic 37: Words like "net revenue" and "total net" belong together, but "sold" as the intruder doesn't seem to break the topic. It could imply a missed categorization in this case.
Generic words
Words like "last year," "prior year," "period," and "compared" show up in many topics (e.g., Topic 26), which indicates that the model is extracting generic financial report phrases without necessarily clustering them into meaningful, distinct groups.
Step 4: Lasso Regression to evaluate Topic association with stock returns
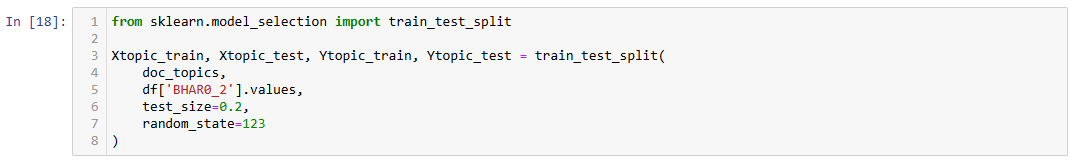
Finally, we’re at the finale! We will now use Lasso regression to evaluate which topics exhibit the strongest associations with stock returns, which is labeled as "BHAR0_2" (or buy-and-hold abnormal returns from days 0 to 2). Note that this column is in percentage (i.e., -4.5 indicates a return of -4.5%).
We will do the following:
Identify the optimum out-of-sample value for
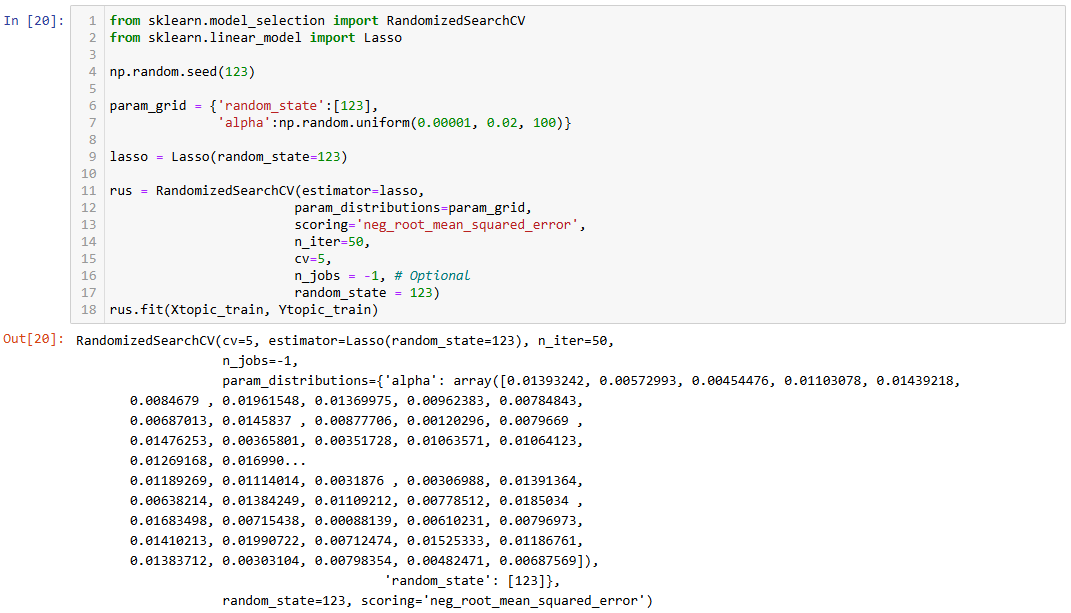
alpha(the primary regularization parameter) usingRandomizedSearchCV. (we will try 100 random values in the range between 0.00001 and 0.02).Analyze results of the best fit models.
To tune the model, we first need do split your data into a training (80%) and validation sample of (20%)
Next, we set up Lasso regression model these parameters for the search:
parameter grid with 100 random values for
alphabetween 0.00001 and 0.02.randomized search runs 50 times and use 5-fold cross-validation.
use
neg_root_mean_squared_errorfor scoring.
To evaluate performance by alpha, we plot the validation neg_root_mean_squared_error vs. alpha

opt_alpha = rus.best_params_['alpha']The optimal alpha = 0.005729925305658085
Conclusion
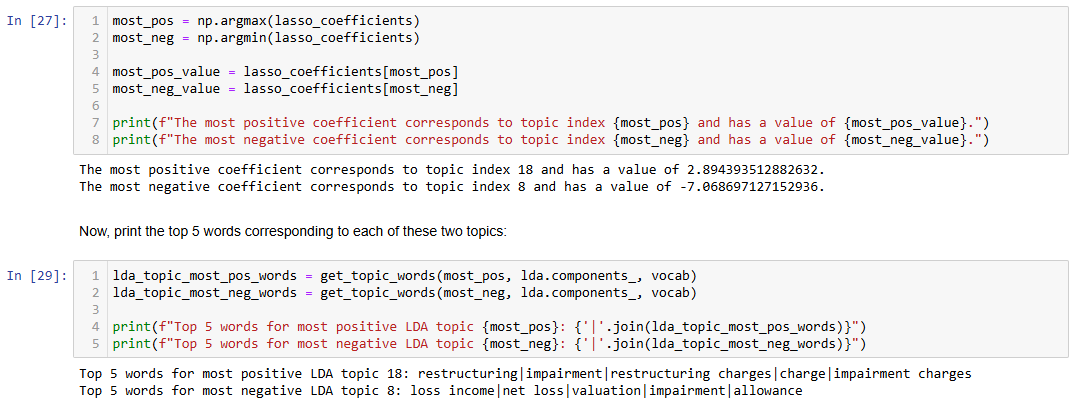
The most positive LDA topic (yields the most positive return) seems to revolve around restructuring events and impairment charges. Restructuring can sometimes be viewed positively by investors, especially if it's seen as a strategic effort to streamline the company, cut costs, or refocus operations. While impairment charges might seem negative in isolation (as they reflect a reduction in asset values), their association with restructuring could signal a company is addressing inefficiencies and preparing for growth. This combination of terms is plausibly positive if investors believe that the restructuring will improve the company's future profitability and competitiveness, which can boost stock returns.
The most negative LDA topic (yields the most negative return) is clearly tied to financial losses and allowance. The terms "net loss" and "loss income" indicate that companies associated with this topic are likely experiencing financial difficulties. "Valuation" and "impairment" suggest that there are also negative adjustments to asset values, often a signal that the company's assets are overvalued or underperforming. It's intuitive that this would be the most negative topic, as terms like "net loss" and "impairment" are closely associated with poor financial health and would likely lead to negative stock returns.
Overall, these results are intuitive. The most positive topic focuses on restructuring, which is often a sign of improvement or future growth potential, while the most negative topic centers around financial losses and impairments, typically leading to negative stock reactions.